
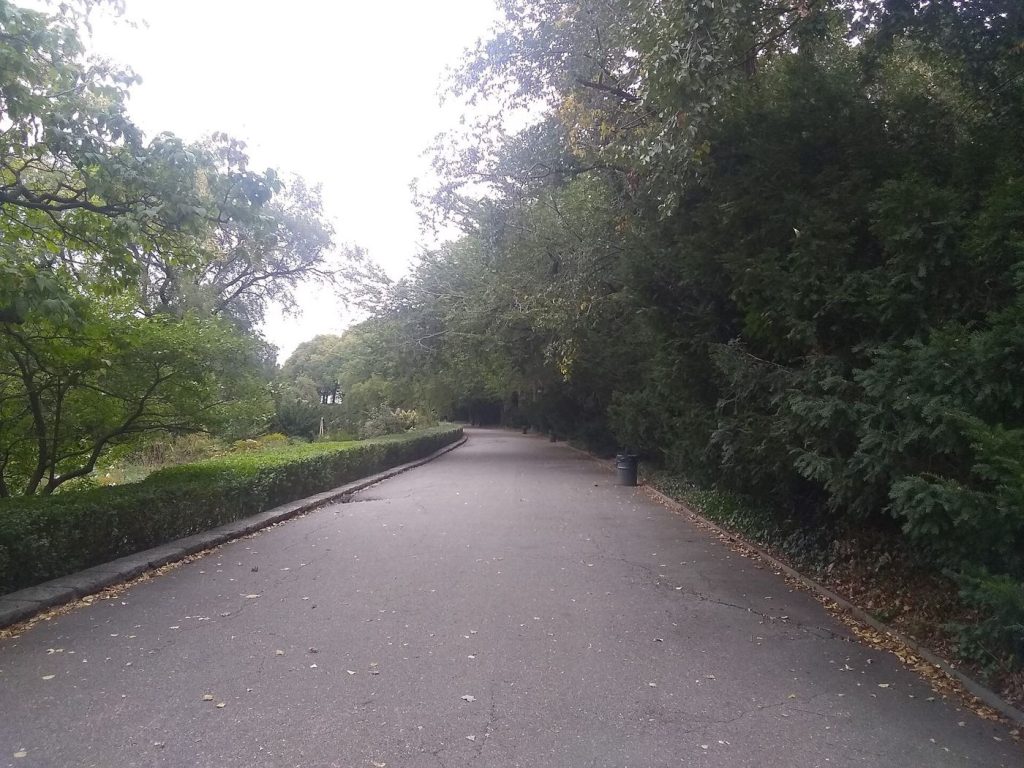
Satellites are now mapping urban heat at the scale of individual streets, showing planners exactly which neighbourhoods overheat most during summer heatwaves. Thermal instruments in orbit measure surface temperatures across whole cities in a single pass, revealing differences of many degrees between leafy districts and dense areas of tarmac, roofing and concrete. Ground teams check those readings with handheld sensors and weather stations, building maps reliable enough to guide spending. The pattern is consistent: shade, water and vegetation cool surroundings measurably, while dark roofs, wide roads and a lack of trees trap heat long after sunset. Night-time temperatures matter most for health, because homes that never cool down leave residents without relief. Older people, young children and outdoor workers face the greatest risk when hot nights follow hot days. City governments are using the maps to decide where to plant trees first, which car parks to resurface with lighter materials and where new pocket parks will help most. Researchers say the technology finally lets councils target cooling measures at the streets where people actually suffer, rather than spreading budgets thinly and evenly.
What the Evidence Shows
The urban heat maps are most powerful when combined with information about who lives in each district. Areas with the highest temperatures often overlap with neighbourhoods where residents have the least access to gardens, air conditioning or cool public buildings. Health researchers overlay hospital admissions during past heatwaves and find a clear relationship with the hottest mapped zones. That evidence is shifting tree planting from a cosmetic exercise into a public health intervention with measurable targets. Engineers are also testing reflective road coatings, permeable paving that holds rainwater, and green roofs that cool the buildings beneath them. Satellite passes repeated over several summers will show whether these interventions genuinely lower temperatures or merely look good in photographs. Planners caution that planting must be matched with watering and maintenance, because young trees die quickly in the very heat they were meant to ease. Used carefully, however, the maps give every city a shared, visible baseline. Residents can see their own street, understand its ranking and hold decision makers to account for promised improvements. Reporting and analysis from sources such as National Science Foundation track the same developments, and specialists following the urban heat maps say the direction is now consistent across independent lines of evidence.
The Wider Context
The wider context is a research landscape in which replication and open data now decide reputations. Findings connected to the urban heat maps are being checked by independent groups with shared datasets, and the teams involved publish their methods in full so rivals can test every step. That discipline is slower than a headline cycle, but it is why results in this area increasingly survive first contact with scrutiny.
What Happens Next
What happens next in the story of the urban heat maps will be decided by follow-up work already under way: larger samples, longer observation and instruments that have not yet come online. The researchers involved are unusually united on one point, that the current results justify the next investment of time and money. Readers will not have to wait long for the first tests of that claim. You can follow related developments in our coverage of science.
There is a practical lesson in all of this for readers deciding what to do today. Start with the verified facts, be wary of anyone promising certainty, and prefer reversible steps while the evidence is still developing. Circumstances differ by country, income and personal situation, so general guidance should always be weighed against your own context before you act on it in any significant or lasting way.
